
This is the rhythm of the Austin market
I track our market week by week, mostly because I always want a "right now" pulse on the market that monthly stats just can't get you - I've been doing it for years!
The coolest part about it is I also get to see how our market changes over time. Look at all these squiggly lines. Make sense? :)
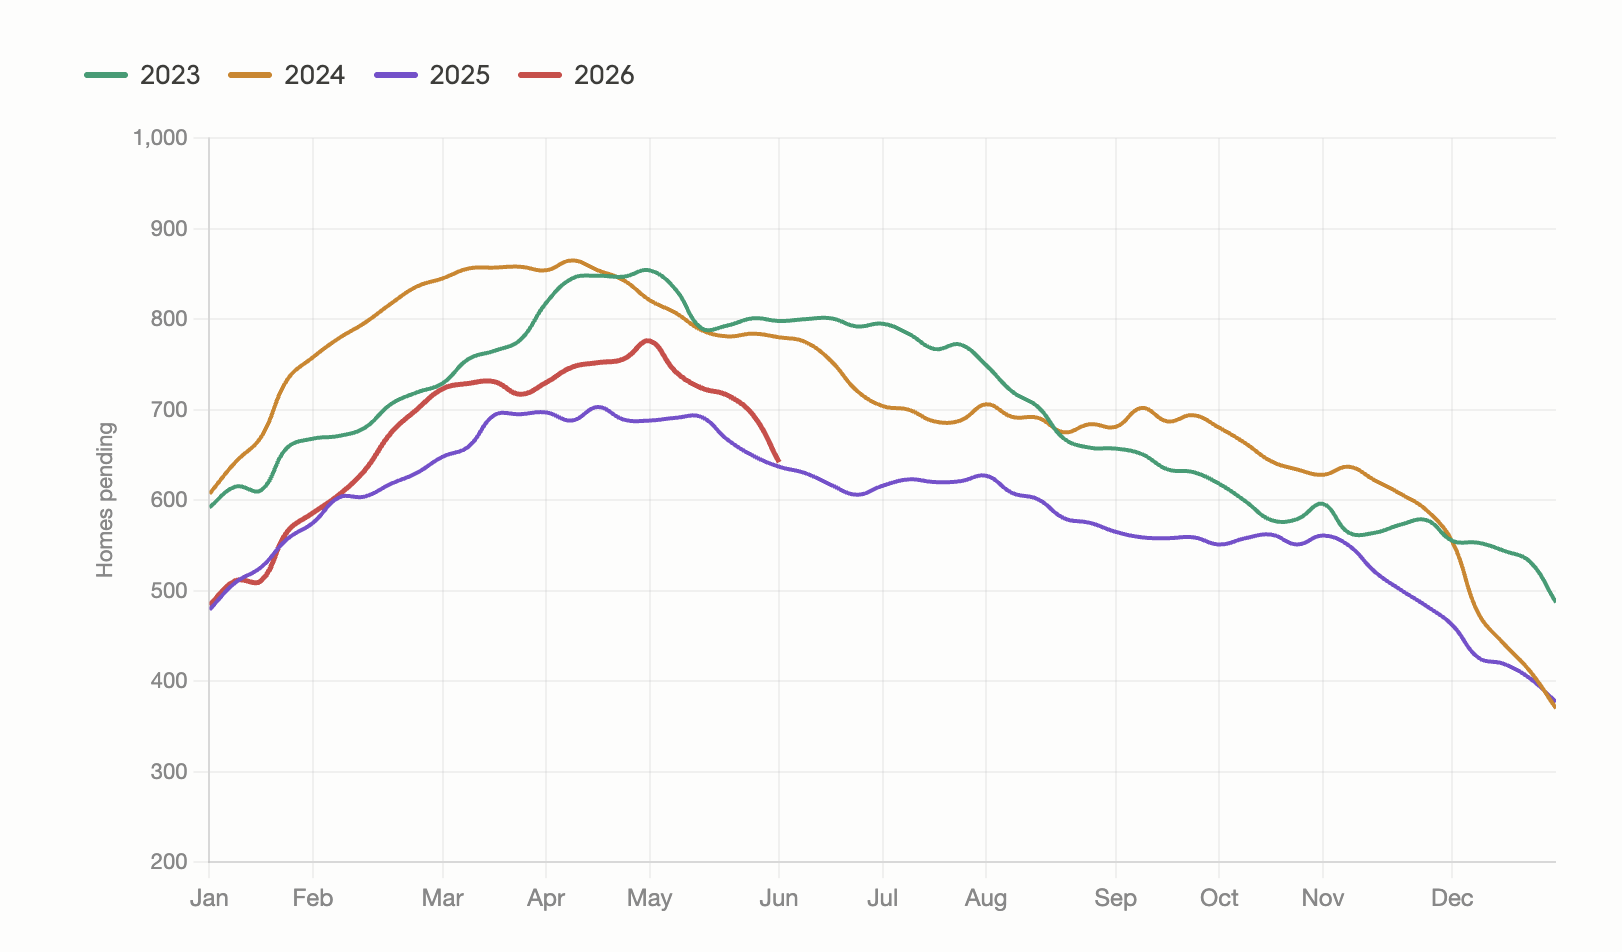
Here's what you're looking at - each year, week by week, how many homes are going under contract. Not deals closing, just going under contract. I like this because it gives us a good gauge of buyer demand and activity.
Here are two things to note:
1. 2025 had noticeably less contracts happening than 2023 and 2024 (all these are post-rate-hike years).
2. The seasonality isn't what most people think. Most people think summer is prime time, but activity peaks before that. March to May is actually the highest activity, then it slowly drifts down for the rest of the year. It doesn't mean if we miss that spring market, we're done for. Really, it holds pretty steady until the end of summer.
One more note, you can see we're tracking above 2025, but below 2023/2024.
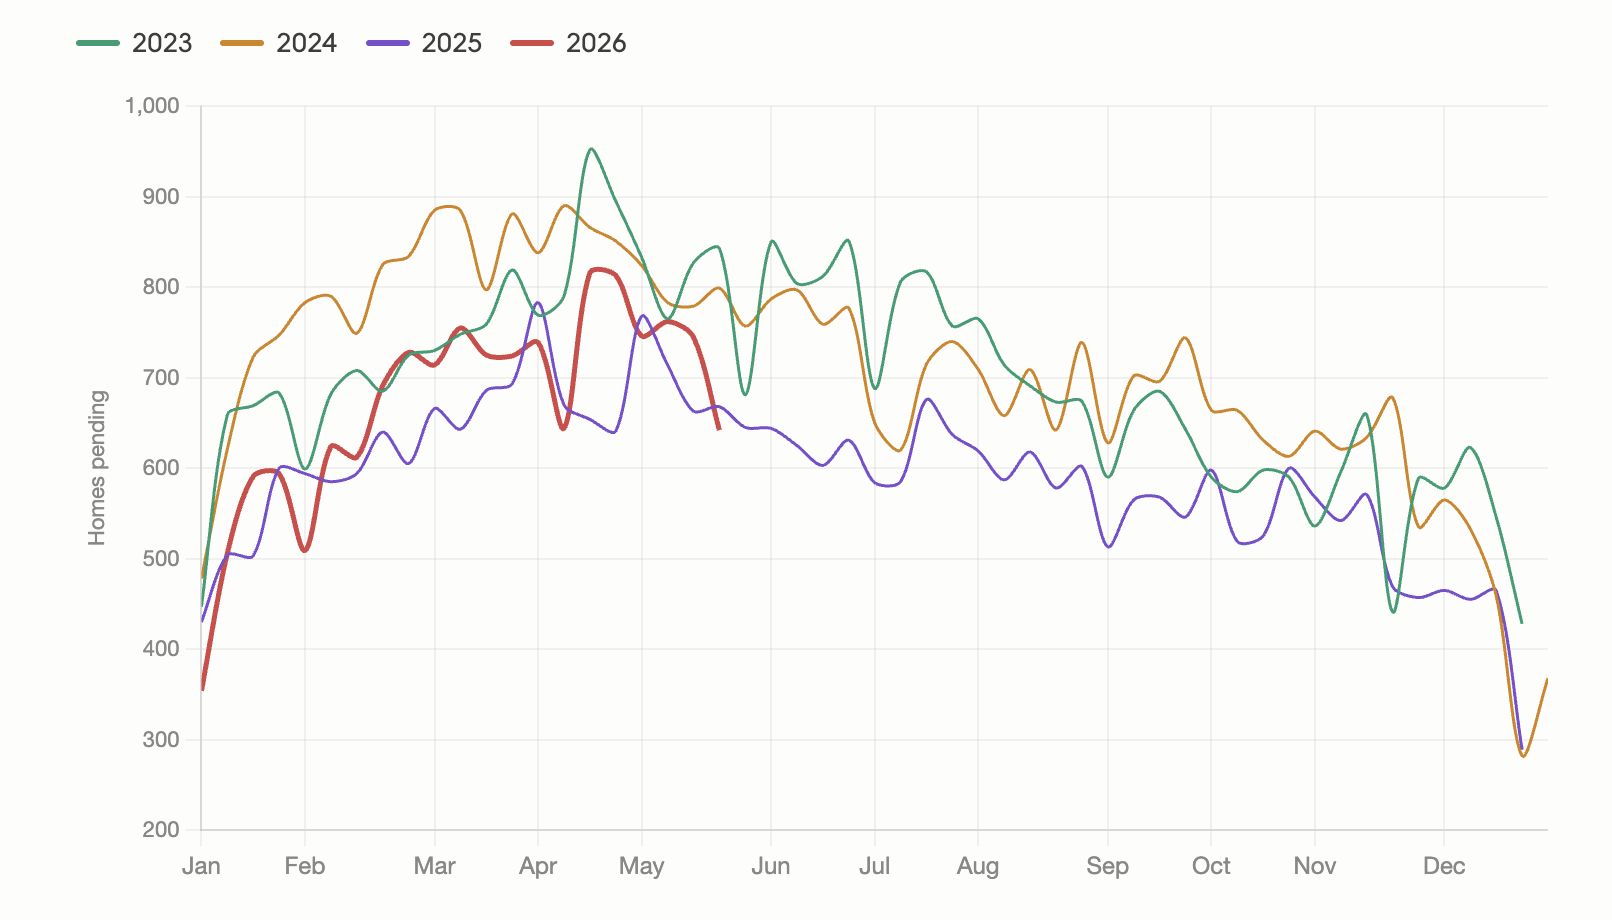
Any takeaways you're getting from this one chart?
PS: The first chart above has been smoothed (for the stats nerds I used a 5 week average). If you want the actual week to week numbers, there’s the second chart which is much more squiggly.
